Modules
 eNtry
eNtry
Initial Analysis
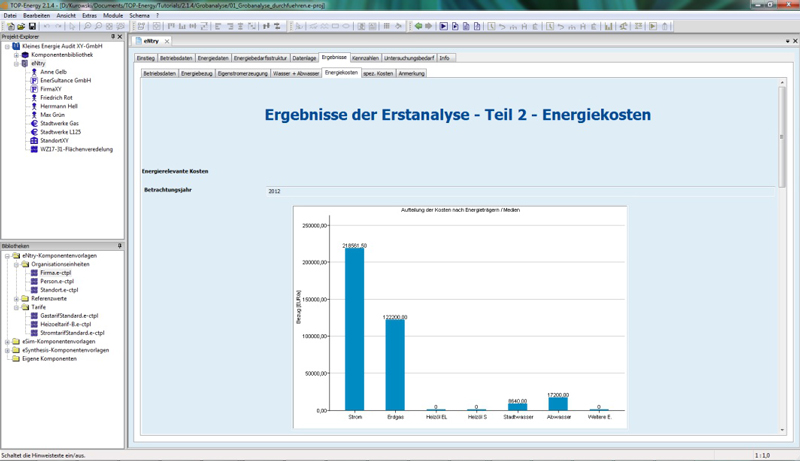
For the first energy-oriented analysis of an industrial company, the essential fundamentals of the company are quickly captured by a questionnaire and transferred to the software.
The module checks the entered data on plausibility, calculates operational energy metrics and compares them with typical international industry values. The results are clearly displayed in charts and tables and exported in a report.
 eSim
eSim
Simulation of Energy Systems
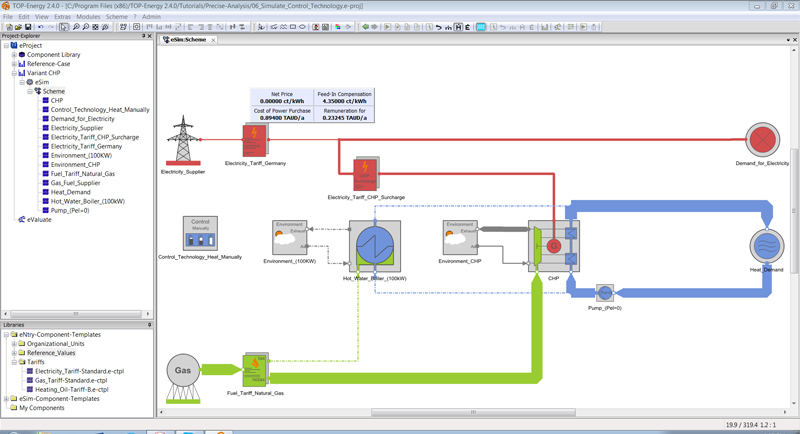
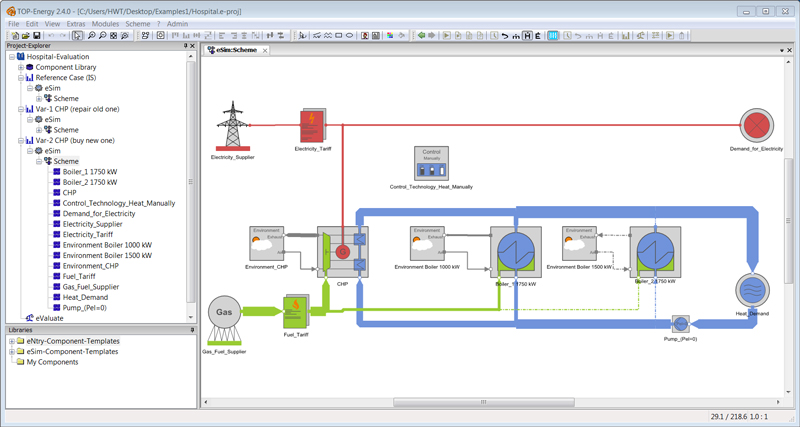
The module eSim simulates and visualizes energy supply systems under specification of temporal load curves and further boundary conditions. Thereby, the costs arising through the energy supply system, as well as the energetic and ecological parameters are determined.
You can either use the prefabricated models and alter them according to your requirements or model your own using the diagram flow scheme.
 eVariant
Comparing the Variants
Module eVariant is used for evaluating and summarizing the results of the simulations. The evaluation of the variants is based on a solid model of balance boundaries, meaning that the evaluation can be viewed from perspectives of different interest groups, for instance: energy suppliers, producers, end energy users.
 eValuate
Economic Appraisal of Variants
Module eValuate performs a comparative assessment of the considered variants on the basis of economical and environmental operating figures, such as net present value, payback period, CO2 emissions, primary energy demand etc.
It estimates key figures for dynamic and static economic appraisal. The graphics of the results can be exported into text processing programs.
 eta
eta
Time series editor
Module eta is responsible for visualizing and editing time series. Measurement data is imported, processed and significant analyzed.
It accounts for the variations that occur due to seasonal use of energy (summer/winter) and stores the enormous amount of data that is generated due to fluctuations in usage.
 eSensitivity
Sensitivity Analysis
>The module eSensitivity is used to investigate the dependence on indicators based on changes in input variables and boundary conditions.
For example, the costs of energy can be varied and thus the dependence of the payback period can be calculated in a simulated power system. Qualitatively, it is possible to estimate the optimal size of a cogeneration unit or a photovoltaic system by using these data.


